With nomination day for the Ward 12 by-election under way today (you can follow updates and get candidate information for the election over on YEGVotes.info), we can expect the campaign (and campaign rhetoric) to really ramp up over the coming weeks. And when it comes to campaigning, a lot has been said about photo radar and it's value to the city. Also, unfortunately, many misconceptions are floating to the surface, so let's go ahead and start dis-spelling the misinformation and find out the real data about photo radar.
First, what do the ticket numbers look like? Well - this data is not currently published anywhere by the city of Edmonton, so I had to make an information request to the Office of Traffic Safety. From 2011-2015, these are the Photo Radar tickets issued by amount over.
| Amount Over Speed Limit | 2011 | 2012 | 2013 | 2014 | 2015 |
|---|---|---|---|---|---|
| 1-5 | - | - | - | - | - |
| 6-10 | 2,462 (1.5%) |
3,252 (2%) |
12,403 (3%) |
66,847 (13%) |
59,544 (12%) |
| 11-15 | 38,222 (26%) |
42,868 (26%) |
109,096 (26%) |
214,474 (42%) |
217,648 (44%) |
| 16-20 | 76,689 (52%) |
85,027 (52%) |
203,721 (48%) |
159,920 (31%) |
152,264 (31%) |
| 21+ | 29,981 (20%) |
31,849 (20%) |
97,500 (23%) |
68,749 (13%) |
68,779 (14%) |
| Total | 147,354 | 162,996 | 422,720 | 509,990 | 498,235 |
And now the net revenues from Photo Radar, by year (2015 is not included because the revenue data is not finalized yet)
| 2011 | 2012 | 2013 | 2014 | 2015 | |
|---|---|---|---|---|---|
| Net Revenue | $13,290,000 | $13,389,000 | $29,294,000 | $34,539,000 | - |
Where does the money go?
A lot of people see photo radar as a "cash cow" that's used to line the city's pockets, but that's generally an oversimplification.
The revenues from photo radar does not go into general revenue at all. Let's look at the 2015 budget to find out where photo radar money is going.
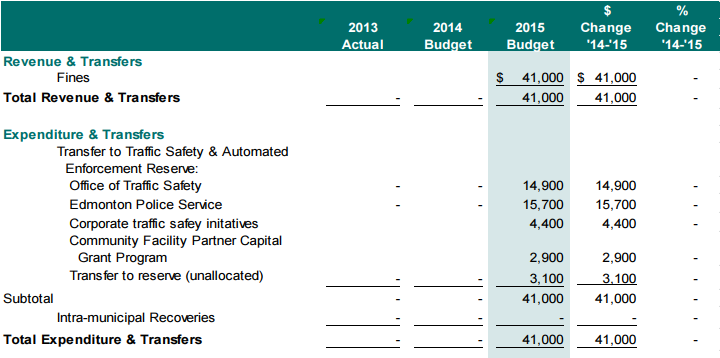
You can see of the 41 million expected to come in, nearly fifteen million was allotted to the Office of Traffic Safety to run the program, leaving 26.1 million projected net revenue. So, where does the revenue go?
15.7 million (60%) to the Edmonton Police Service
4.4 million (17%) supports traffic safety initiatives
3.1 million (12%) Transfer to Photo Radar Reserve fund
This is a fund to ensure operation of the program year-to-year in cases where the revenue for a subsequent year is less than expected.
2.9 million (11%) Community Facility Partner Capital Grant Program
This is a program that supports partnerships to enhance public use facilities in areas like Arts & Heritage, Multi-Cultural, Recreation, and Community Development.
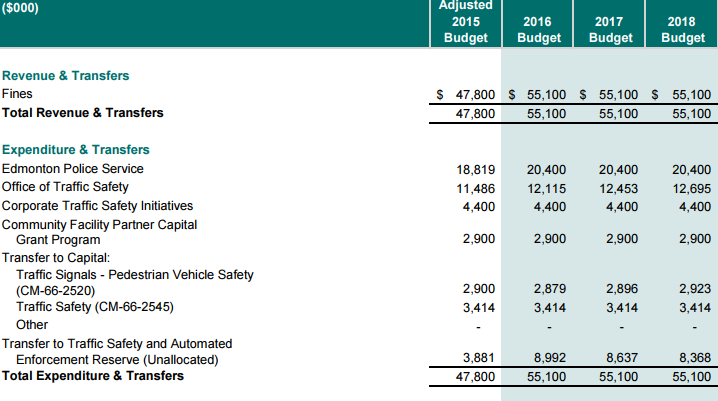
Just a few months ago the city of Edmonton passed a multi-year budget for 2016-2018, which means we also know where the city project photo radar revenues will go for the next three years, as well as the predicted intake from fees.
I won't begin to editorialize here, as it's up to each Edmontonian to form their own opinions on our Automated Enforcement program, but I will discuss some common arguments (and do my best not to strawman them!).
"We should scrap Photo Radar and get police boots on the ground instead"
Photo Radar is operated by the City of Edmonton, not the Edmonton Police Service, so civic employee time is spent operating it, not police time. Of course police presence is an effective tool, but this need not necessarily be an either-or situation, over the next three years Photo Radar is planned to transfer $60 million to the EPS - and more money is effective at getting more boots on the ground.
"Photo radar tickets for lower speeds than it used to"
Photo radar still doesn't ticket for 1-5 over. That said, yes, definitely if you look at the percentages issued, from 2014 on, the percentage of tickets issued for 6-10 over jumped by around 300% and appears to be holding at that rate. The number of tickets issued for 11-15 over jumped 62%, showing an overall trend of moving photo radar to lower-speed locations, or lowering the threshold for which tickets are typically issued.
Future Considerations
Some data that is confirmed to exist, but was not released to me is how many of these tickets are issued to repeat offenders. The Office of Traffic Safety informed me that that data is released to EPS on a weekly basis. As well, the City of Edmonton posts locations of Photo Radar vans on the Photo Radar page here: http://www.edmonton.ca/transportation/traffic_safety/photo-radar.aspx, but there is currently no breakdown available for number of tickets based on the location the ticket was issued.
That piece of data would be interesting for determining whether lower-difference tickets are issued in lower-speed areas, with a greater focus on enforcement in those areas, or if Photo Radar on high speed roads is trending downwards in terms of the threshold for issuing tickets.
I encourage all of you to generate your own opinions about this data and feel free to share those up with your Councillors. I hope this helps us all to argue our perspectives from a point of knowledge.
If you have any questions or something you think should be added here, feel free to reach out on [Twitter: @troypavlek]({{ $page->twitter_url }})
Update 1
/u/Planner_Hammish on Reddit brings up a really good point about the huge jump in tickets issued between 2012 and 2014. One look at the report shown at the September 8, 2014 Audit Committee (PDF Warning) shows that by the end of 2012, the photo radar program was $47 million over budget (the budget was $6.6 million).
The document kindly notes, however:
"the program cost overruns were fully covered by program revenues, so there was no draw from the tax levy"